REST DEFENCE ANALYZER
Who protects the attack?
Inspect the structure left behind when possession changes, then follow the recorded transition.
Loading the verified match…
Loading source-backed results. No live feed or account is required.
Attacking losses: ≥2 seconds of prior control, with the pre-loss ball in the opposition half. Event alignment remains approximate.
No turnovers match these filters. Broaden the team, half or event selection.
Pre-loss structure
● Losing team▲ Counterattacking team□ Goalkeeper ring× Central cell >5 m from rest defence
Own goal on the left. The losing team attacked right. Shirt numbers identify players. Corridors are static geometric candidates, not established passing opportunities.
THE BOUNDED TRANSITION
OUTCOME VALIDATION
A score needs evidence
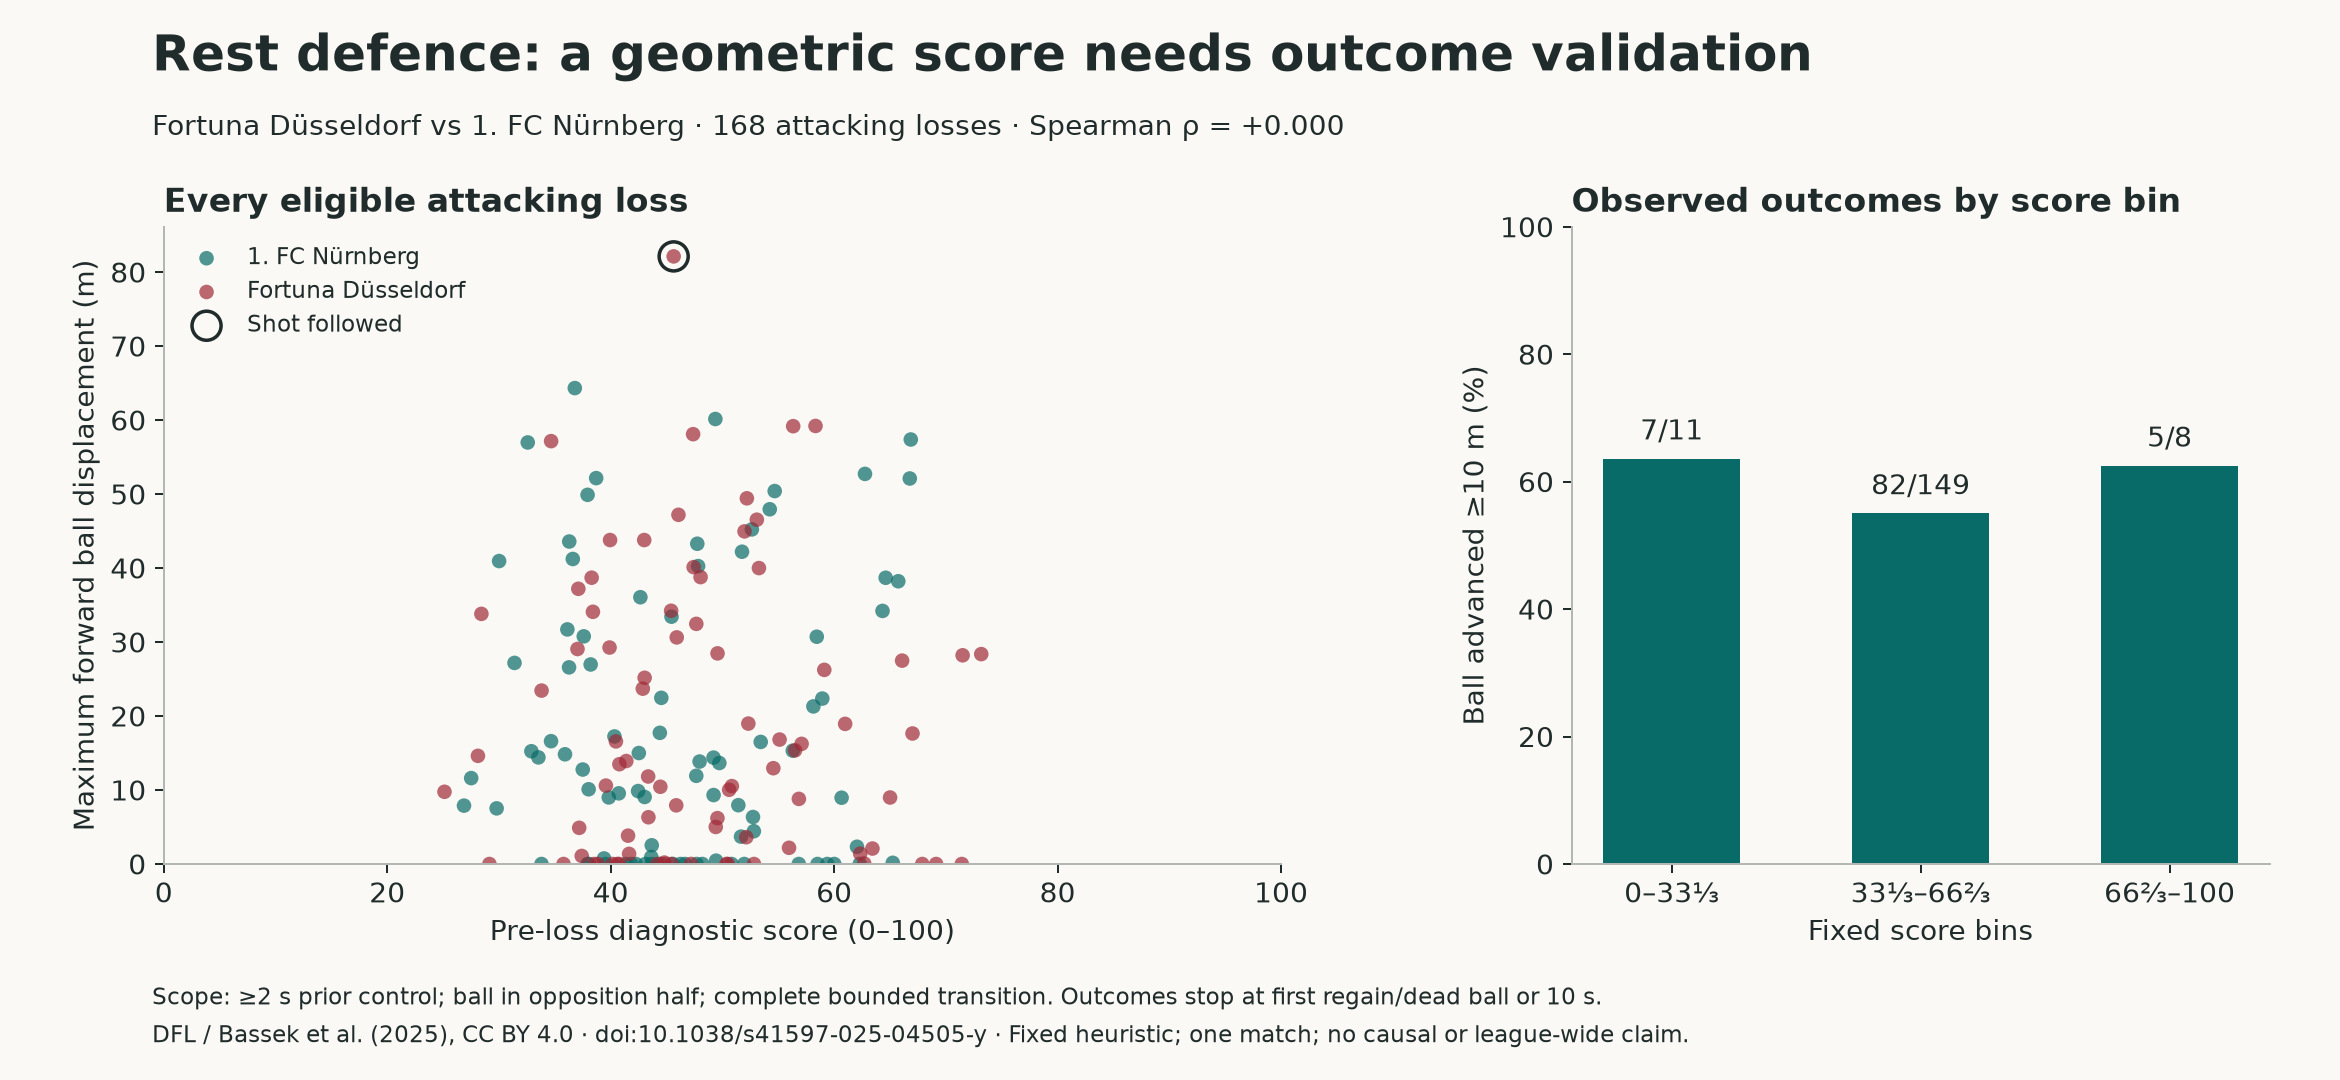
The fixed diagnostic's correlation with subsequent ball movement is approximately zero in this match. It is an exploratory heuristic, not a calibrated risk estimate.
Each point is one uncensored turnover with a defined score. Click a point, or focus it and press Enter, to inspect it.
Red: Düsseldorf losses. Teal: Nürnberg losses. A square identifies a shot. Ball movement can include a pass in flight. Adjacent turnovers are not independent observations.
What these measurements mean
Definitions, outcomes and score
Behind-ball coverage counts outfield players level with or goal-side of the ball; the goalkeeper is separate. RMS compactness measures spread around their centroid. Central exposure uses a 2 m grid in a pitch-clipped 30 × 20 m rectangle toward the losing team's own goal, marking cells more than 5 m from every behind-ball outfield player.
Counter options are opposition outfield players at least 3 m toward the losing team's goal and within 40 m of the ball. Clear corridors have no losing-team outfield player within 2 m of the straight segment, excluding endpoints. Speed, orientation, pressure, offside and aerial flight are not modelled.
The score averages numerical shortfall, RMS spread, central exposure and clear-corridor fraction, using fixed declared constants. No model was fitted. Features use the last complete 5 Hz player snapshot strictly before the 25 Hz possession switch.
Outcomes stop at the first regain, inactive ball, gap, unknown control, half end or ten seconds. Incomplete observations are censored and excluded from outcome rates. Shots prefer available corrected frame references; other timestamps remain approximate.
Sources, reliability and reproducibility
One complete Düsseldorf–Nürnberg match is validated here: 293 accepted turnovers, including 168 in the default attacking-loss scope. All 293 behind-ball counts were independently checked against native XML. Seven selected source matches support method development and case studies, not league-wide claims.
This website filters a reviewed historical snapshot. It does not rerun the Python detector or analyze new matches. Replays use recorded 5 Hz player frames without interpolation; the ball-movement chart uses the native 25 Hz stream.
Data: Deutsche Fußball Liga (DFL). Bassek, Rein, Weber & Memmert (2025), Scientific Data 12, 195. Original dataset, CC BY 4.0. Coordinates are rotated and metrics derived. No endorsement is implied.
Findings report · Publication chart · Data attribution · Independent count audit · Release fingerprint